Large-Cap Funds After the Pullback: What Stability Scores Show
Weekly FundMatrix Stability Scores for 30 Large Cap Direct Growth funds since April 2021, and how 29 fund houses' scores changed between 31 July and 9 October 2026.
Recent market pullbacks have put large-cap equities back in the conversation, and some fund managers and investors describe the correction as an entry point. This post leaves that debate aside. It reports one thing: how the FundMatrix Stability Score of Large Cap funds has moved over its history, and how each fund house's flagship Large Cap fund moved during the recent window.
Scope
- Funds: Direct Plan, Growth option, SEBI category Large Cap. 23 funds were scored in April 2021, rising to 30 by 2026.
- Window: the last snapshot on or before 7 August 2026 (31 July) compared with the latest snapshot (9 October 2026).
- Exclusions in the fund-house comparison: two funds with insufficient history, and one international fund (ICICI Prudential US Bluechip Equity) that carries the Large Cap category label. That leaves 29 funds, one per fund house.
- The Stability Score runs from 0 to 100 and is built from several measures over long windows, so it moves slowly.
Large-Cap Stability Score since 2021
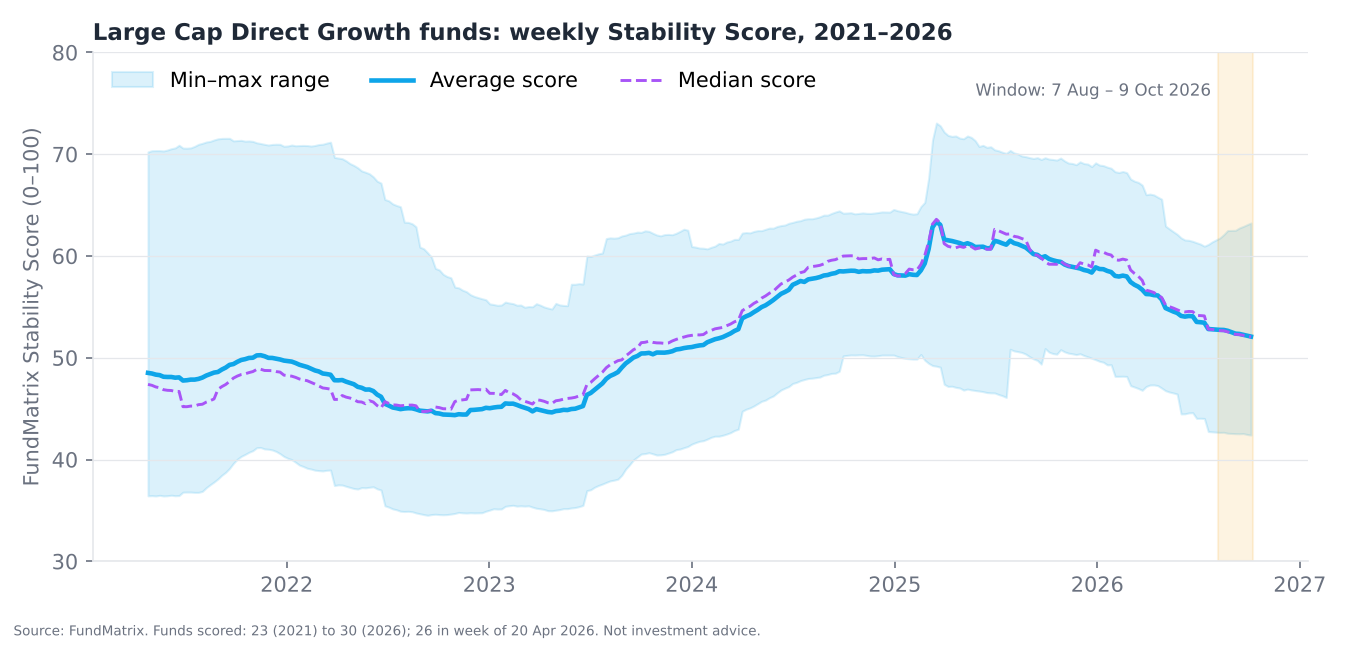
- The category average was 48.51 in the week of 26 April 2021.
- Its lowest weekly average was 44.36 (week of 31 October 2022).
- Its highest was 63.38 (week of 17 March 2025).
- It was 52.79 in the week of 27 July 2026 and 52.08 in the week of 5 October 2026.
- Over the full history the weekly spread between the lowest and highest fund ranged from 13.9 to 34.4 points. On 5 October 2026 it was 42.40 to 63.24.
Fund houses: 31 July vs 9 October 2026
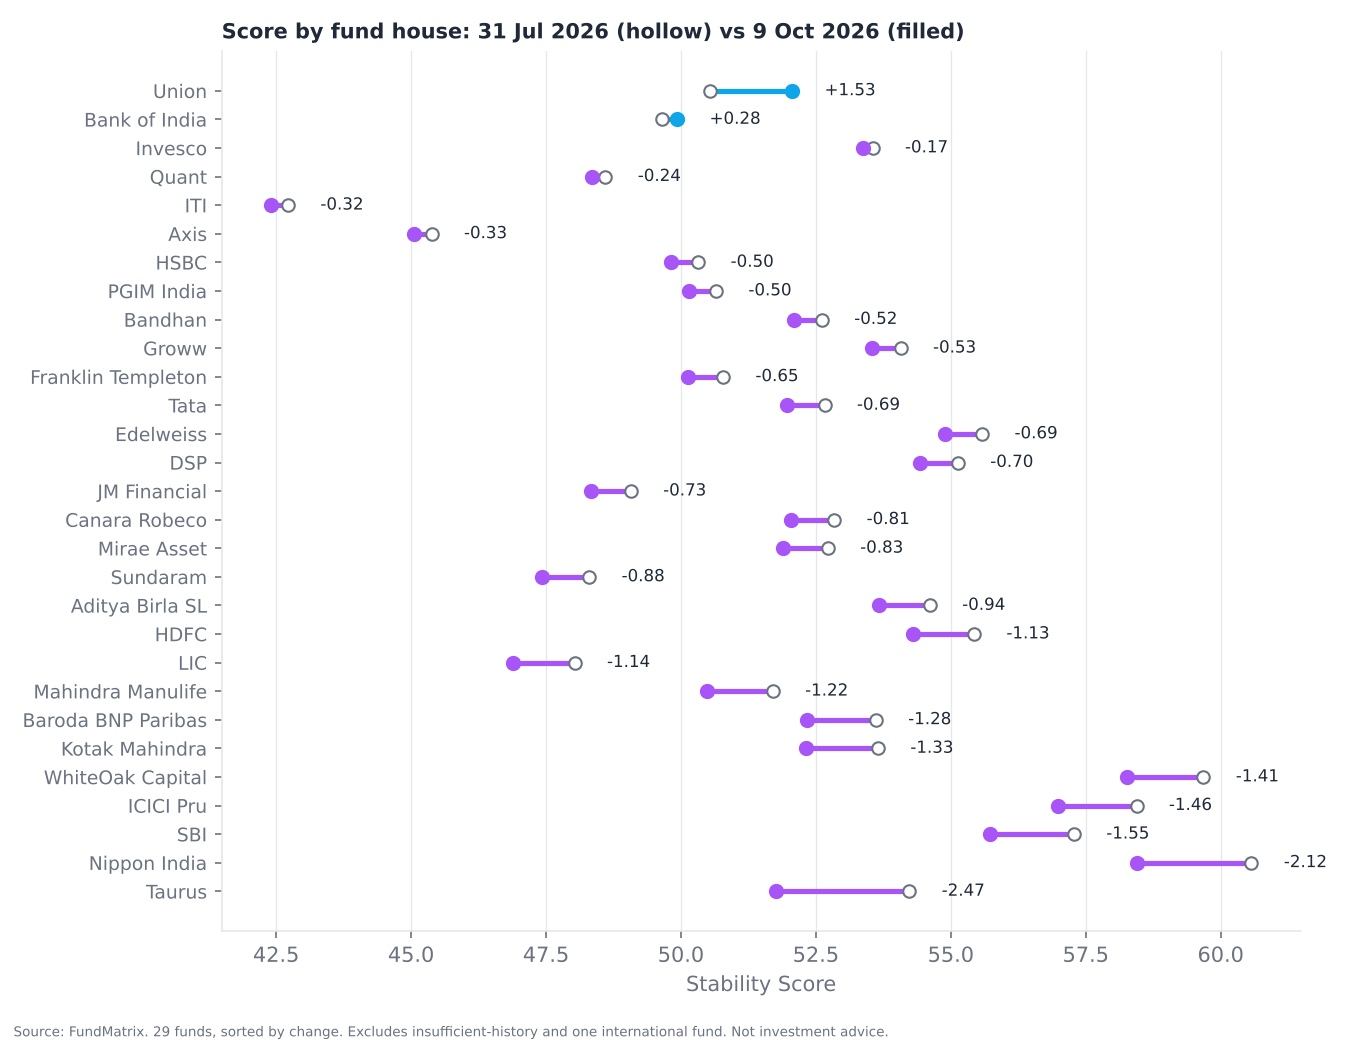
- 27 of 29 fund houses recorded a lower score on 9 October than on 31 July. 2 recorded a higher score.
- The average score moved from 52.50 to 51.69, a change of -0.80 points.
- The largest declines: Taurus (-2.47), Nippon India (-2.12), SBI (-1.55), ICICI Prudential (-1.46) and WhiteOak Capital (-1.41).
- The smallest changes or increases: Union (+1.53), Bank of India (+0.28), Invesco (-0.17), quant (-0.24) and ITI (-0.32).
- Median change: -0.69 points.
| Fund house | 31 Jul 2026 | 9 Oct 2026 | Change |
|---|---|---|---|
| Union | 50.53 | 52.06 | 🟢 +1.53 |
| Bank of India | 49.65 | 49.93 | 🟢 +0.28 |
| Invesco | 53.55 | 53.38 | 🔻 -0.17 |
| quant | 48.60 | 48.36 | 🔻 -0.24 |
| ITI | 42.72 | 42.40 | 🔻 -0.32 |
| Axis | 45.38 | 45.05 | 🔻 -0.33 |
| HSBC | 50.32 | 49.82 | 🔻 -0.50 |
| PGIM India | 50.65 | 50.15 | 🔻 -0.50 |
| Bandhan | 52.61 | 52.09 | 🔻 -0.52 |
| Groww | 54.07 | 53.54 | 🔻 -0.53 |
| Franklin Templeton | 50.78 | 50.13 | 🔻 -0.65 |
| Tata | 52.66 | 51.97 | 🔻 -0.69 |
| Edelweiss | 55.58 | 54.89 | 🔻 -0.69 |
| DSP | 55.13 | 54.43 | 🔻 -0.70 |
| JM Financial | 49.07 | 48.34 | 🔻 -0.73 |
| Canara Robeco | 52.84 | 52.03 | 🔻 -0.81 |
| Mirae Asset | 52.72 | 51.89 | 🔻 -0.83 |
| Sundaram | 48.30 | 47.42 | 🔻 -0.88 |
| Aditya Birla Sun Life | 54.61 | 53.67 | 🔻 -0.94 |
| HDFC | 55.43 | 54.30 | 🔻 -1.13 |
| LIC | 48.03 | 46.89 | 🔻 -1.14 |
| Mahindra Manulife | 51.70 | 50.48 | 🔻 -1.22 |
| Baroda BNP Paribas | 53.61 | 52.33 | 🔻 -1.28 |
| Kotak Mahindra | 53.65 | 52.32 | 🔻 -1.33 |
| WhiteOak Capital | 59.68 | 58.27 | 🔻 -1.41 |
| ICICI Prudential | 58.44 | 56.98 | 🔻 -1.46 |
| SBI | 57.28 | 55.73 | 🔻 -1.55 |
| Nippon India | 60.57 | 58.45 | 🔻 -2.12 |
| Taurus | 54.23 | 51.76 | 🔻 -2.47 |
Weekly paths, June to October 2026
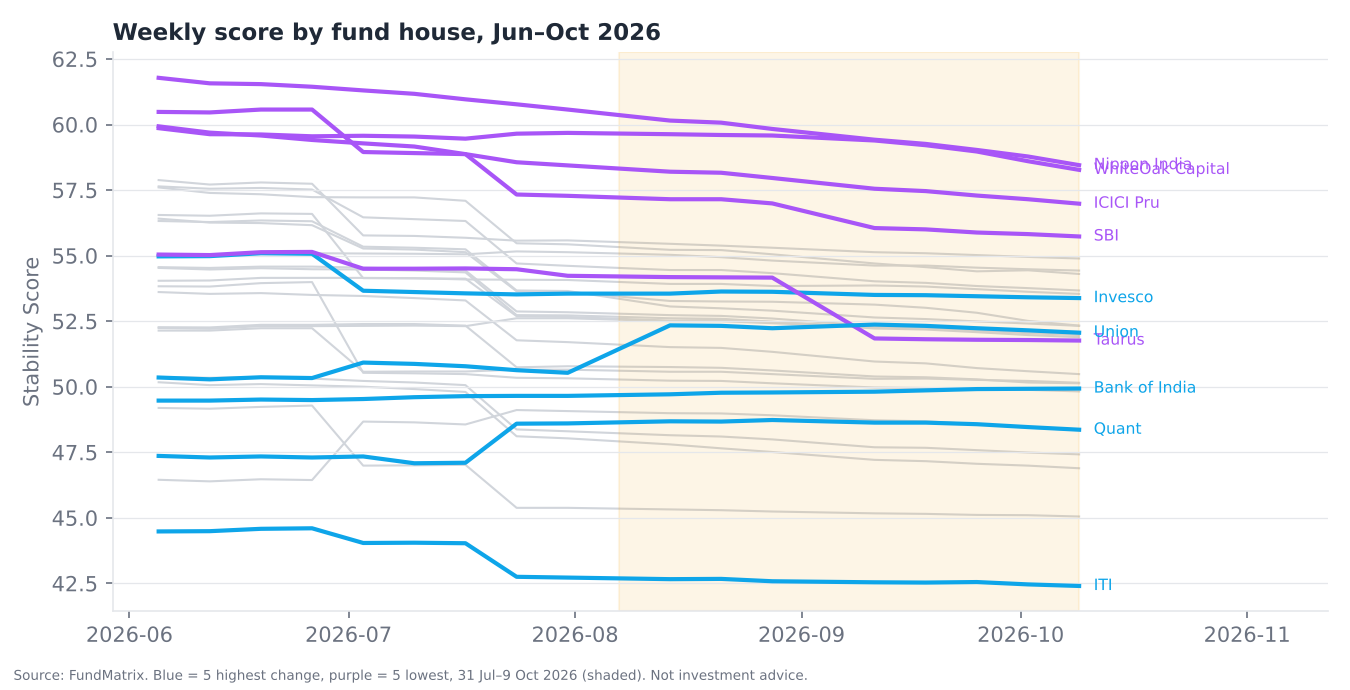
The five fund houses with the largest declines (purple) and the five with the smallest changes or increases (blue) are highlighted; all others are in grey.
Explore the data
See each fund's score history, band and peers on the Large Cap category page at FundMatrix.
Source: FundMatrix Stability Score history, weekly snapshots. This is not investment advice. FundMatrix is an independent analytics platform and is not registered with SEBI or AMFI. Mutual fund investments are subject to market risk. Past scores do not indicate future results.
Explore the data behind this analysis
FundMatrix tracks 15,000+ funds with stability scores, TER history and risk metrics updated daily.
Explore Fund Data →