Indian IT and Technology Funds: Partial Recovery, Still Far From the Peak
Nifty IT TRI is up 19.7% from its July 2026 low but 30.6% below its December 2024 peak. How 10 technology funds, the broad indices and FundMatrix Stability Scores have moved.
Indian IT stocks have bounced from their lows, while broad indices have slipped again since August. This post puts numbers on both, using index total-return data and the NAVs and FundMatrix Stability Scores of 10 technology and digital funds. It reports what the data shows and draws no conclusion about what comes next.
Scope
- Funds: 10 Direct Plan, Growth option funds with a technology or digital mandate, all domestic. Funds with a short history or a classification we are still verifying are excluded.
- Indices: Nifty IT TRI, Nifty 50 TRI and Nifty 500 TRI (total-return indices).
- Window: 13 December 2024 (the Nifty IT TRI peak) to 15 October 2026. Charts use weekly data to 9 October 2026.
- The Stability Score runs from 0 to 100 and is built from several measures over long windows, so it moves slowly.
Indices: where they stand
| Index | Peak date | Trough date | Fall, peak to trough | Change from trough | vs peak (15 Oct 2026) |
|---|---|---|---|---|---|
| Nifty IT TRI | 13 Dec 2024 | 1 Jul 2026 | -42.0% | +19.7% | -30.6% |
| Nifty 50 TRI | 2 Jan 2026 | 30 Mar 2026 | -15.1% | +3.8% | -11.8% |
| Nifty 500 TRI | 2 Jan 2026 | 30 Mar 2026 | -14.7% | +8.8% | -7.2% |
- Peaks are measured over the 24 months to 15 October 2026.
- Nifty IT's low came on 1 July 2026, three months after the broad indices bottomed.
- Nifty 500 TRI reached 103.28 (rebased) in the week of 7 August 2026 and was 95.30 in the week of 9 October. Nifty 50 TRI went from 100.47 on 31 July to 92.92 on 9 October.
Technology funds against the indices
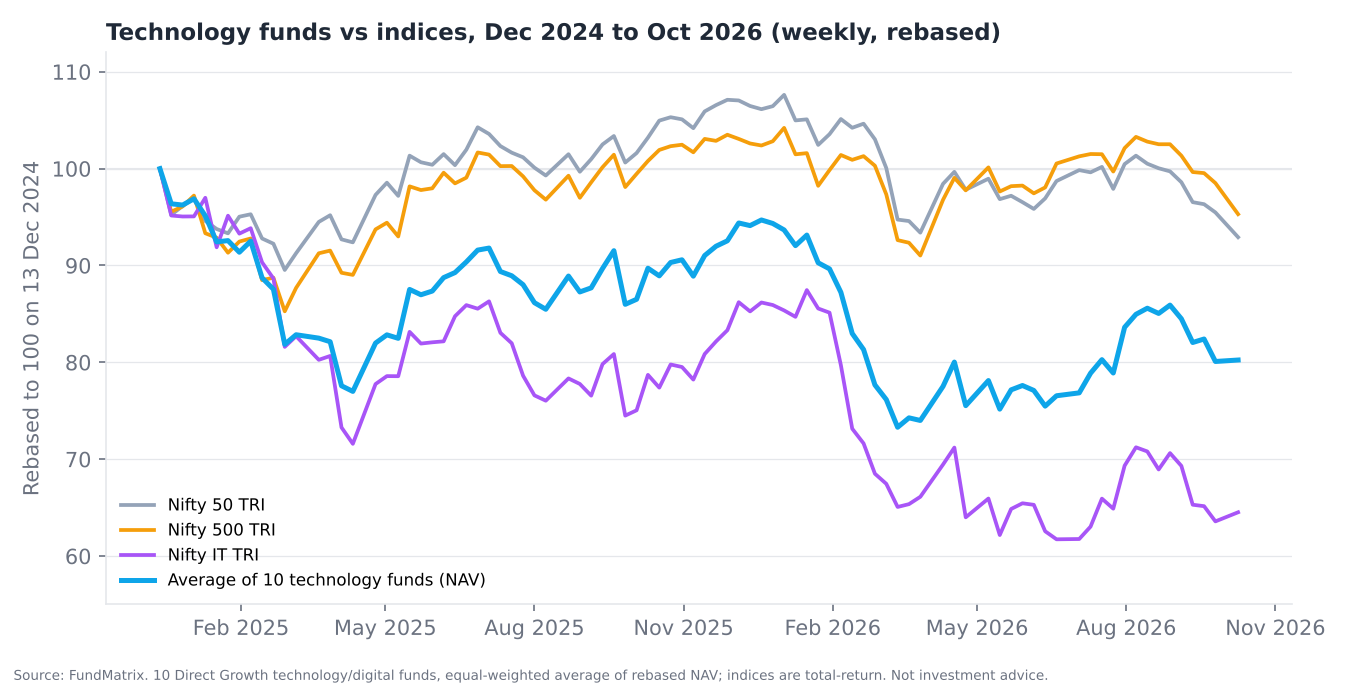
- The 10-fund average NAV (rebased to 100) fell to 77.00 in the week of 11 April 2025 and recovered to 94.70 by 19 December 2025.
- It then fell to 73.30 in the week of 13 March 2026, its low in the window.
- It reached 85.91 in the week of 28 August 2026 and stood at 80.24 in the week of 9 October.
Fund by fund
| Fund | Max fall in window | Change from trough | vs peak | Score change, 12 months |
|---|---|---|---|---|
| Invesco India Technology Fund | -28.1% | +28.5% | -7.6% | -1.45 |
| SBI Technology Opportunities Fund | -24.2% | +12.5% | -14.8% | -9.17 |
| Tata Nifty India Digital ETF FoF | -27.9% | +17.7% | -15.2% | -10.82 |
| HDFC Nifty India Digital Index Fund | -27.5% | +17.0% | -15.2% | n/a |
| Franklin India Technology Fund | -24.8% | +10.0% | -17.2% | -8.81 |
| Aditya Birla Sun Life Digital India Fund | -30.6% | +16.5% | -19.2% | -11.17 |
| Kotak Technology Fund | -28.6% | +12.8% | -19.5% | -10.76 |
| ICICI Prudential Technology Fund | -28.0% | +11.4% | -19.8% | -13.78 |
| HDFC Technology Fund | -30.6% | +15.4% | -19.9% | -20.95 |
| Tata Digital India Fund | -33.3% | +10.4% | -26.3% | -11.94 |
- Across the 10 funds, the average maximum fall was 28.4%, the average gain from trough was 15.2% and the average distance below peak was 17.5%.
- The smallest gap to peak was 7.6% (Invesco India Technology Fund) and the largest was 26.3% (Tata Digital India Fund).
- Peak and trough dates differ by fund. The HDFC Nifty India Digital Index Fund does not yet have 12 months of score history.
- Score change is the 9 October 2026 score minus the score 12 months earlier, in points.
Stability Scores of the same funds
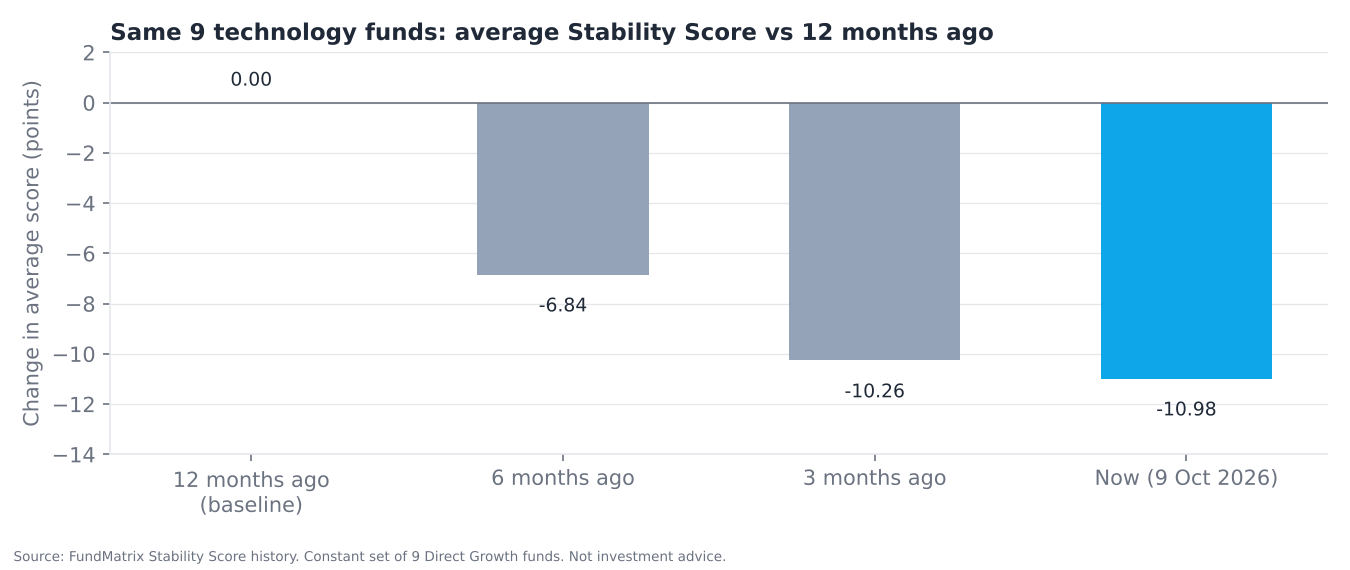
- For the 9 funds with 12 months of history, the average score fell 6.84 points over the first six months, a further 3.42 over the next three, and 0.72 over the most recent three. The decline has slowed but has not reversed.
- All 9 funds have a lower score than 12 months ago. 3 of the 9 are higher than 3 months ago.
- Across the 14 domestic equity categories, the average score fell in every one over the last 13 weeks. Sectoral Technology fell 1.25 points, against 1.60 for Large Cap and 0.07 for Small Cap.
What the data shows
- Technology funds and the Nifty IT index have recovered part of their losses but remain well below December 2024 levels.
- The broad indices fell later and recovered less lately: both are down in the weeks since early August.
- Scores of technology funds have declined steadily for a year; the pace of decline has slowed in the last three months.
Explore the data
Compare funds, categories and score history on the FundMatrix category page.
Source: FundMatrix Stability Score history, benchmark index history and fund NAV data. Index peak, trough and current values cover the 24 months to 15 October 2026; weekly series end 9 October 2026. This is not investment advice. FundMatrix is an independent analytics platform and is not registered with SEBI or AMFI. Mutual fund investments are subject to market risk. Past performance and past scores do not indicate future results.
Explore the data behind this analysis
FundMatrix tracks 15,000+ funds with stability scores, TER history and risk metrics updated daily.
Explore Fund Data →